![KK Icon.png]](https://knowledge.kidkare.com/hs-fs/hubfs/KK%20Icon.png?width=40&height=40&name=KK%20Icon.png)
Beacon Verify is a command center for managing CACFP claims across your network of providers. Rather than navigating to each center individually, the dashboard shows claim status, errors, readiness, and estimated reimbursement for your entire organization — all in one place.
The dashboard has two views:
- My Portfolio — A claims manager's working view. Displays the full site table with tools for filtering, sorting, taking action, and sending notifications.
- Executive — An organization-level summary for leadership, with KPI cards, trend charts, and revenue opportunity alerts.
In this article, we will cover working in the Executive View. For information on the Portfolio View, head on over to Beacon Verify: Portfolio View.
Accessing Beacon Verify
Once Beacon Verify is enabled for your account, it becomes your default Home page, and will display the Portfolio view by default. However, if you need to return to Beacon Verify, simply click Beacon Verify from the menu to the left.

Switch to Executive View
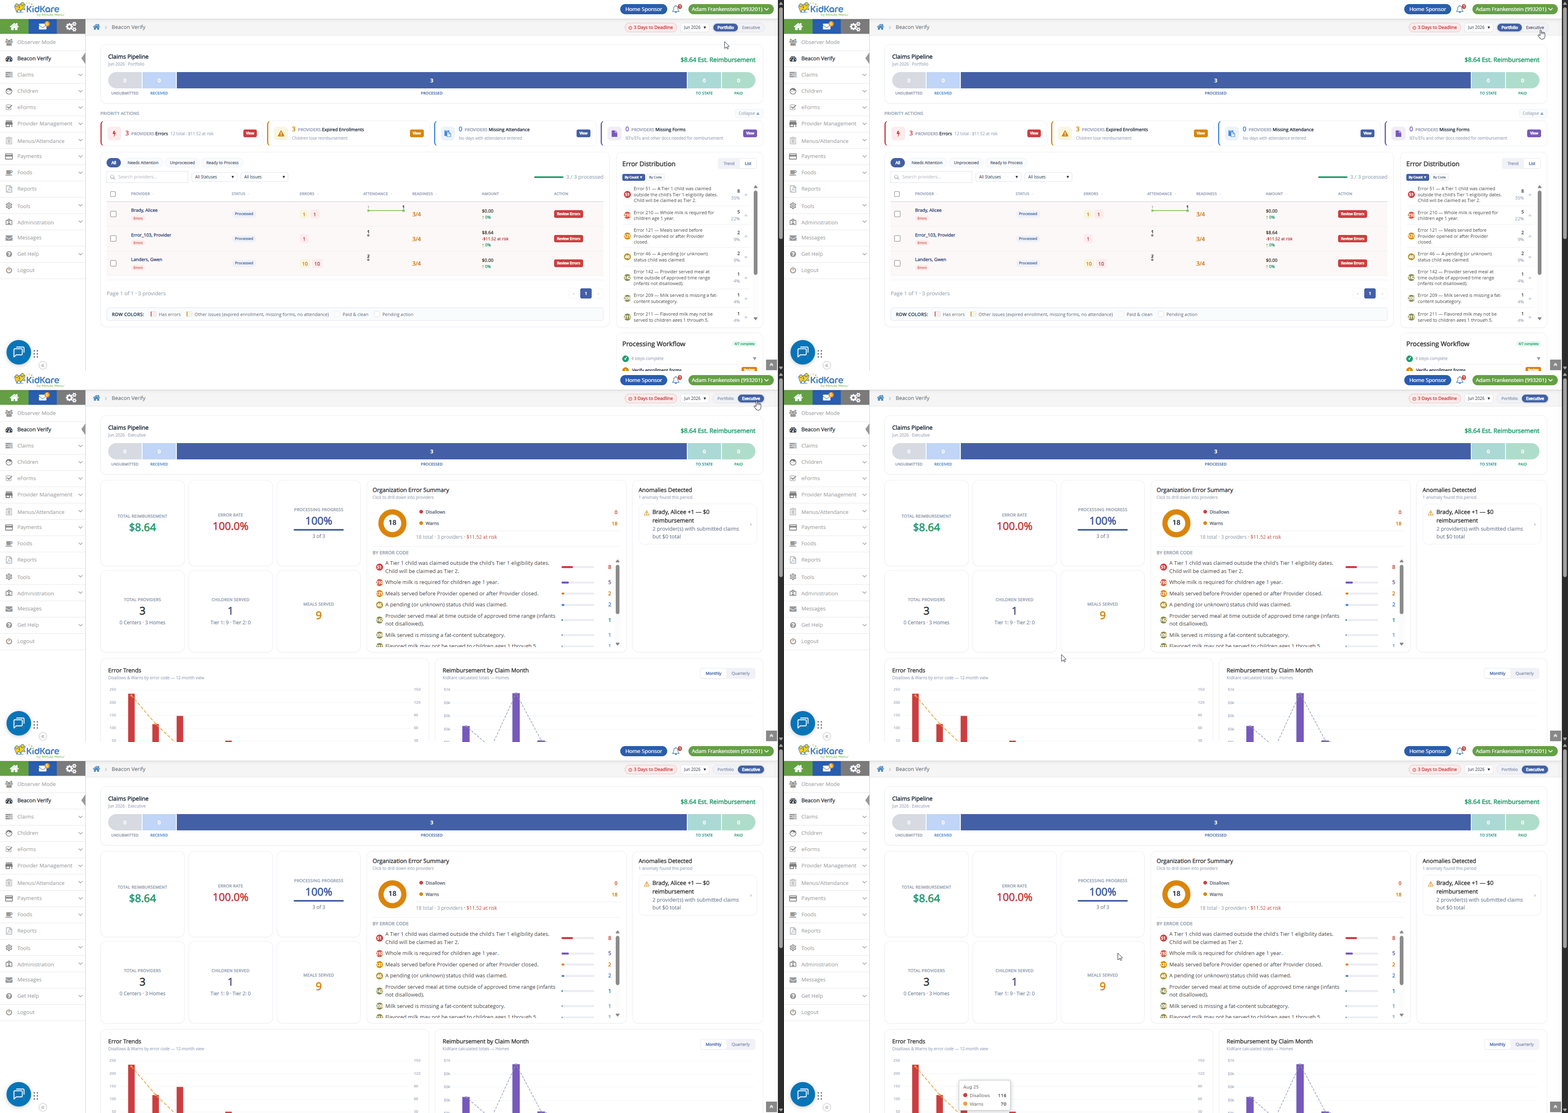
Once you've landed in Beacon Verify, click the Executive toggle in the top-right corner to switch to Executive view.
What Executive View Includes
Executive view gives leadership a bird's-eye-view of claims and claim trends across the organization, including reimbursement trends by claim month and quarter.
- Claims Pipeline: An at-a-glance look at claims progression for the selected Claim Month.
- KPI cards — Total Reimbursement, Error Rate, Processing Progress, Total Providers, Children Served, and Meals Served.
- Organization Error Summary — A breakdown of disallows and warnings, with total dollars at risk. Click to drill into the providers behind each error.
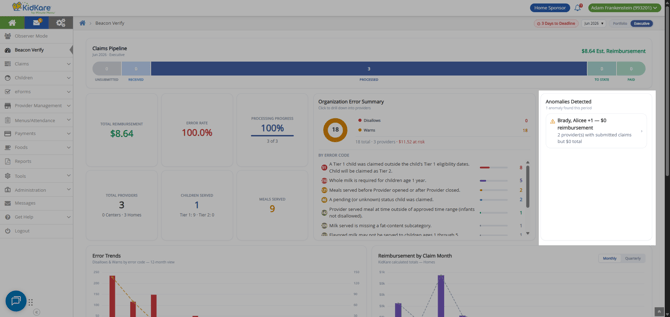
- Anomalies Detected — Providers that stand out, such as an unusually high error count, zero reimbursement on a processed claim, or zero attendance.
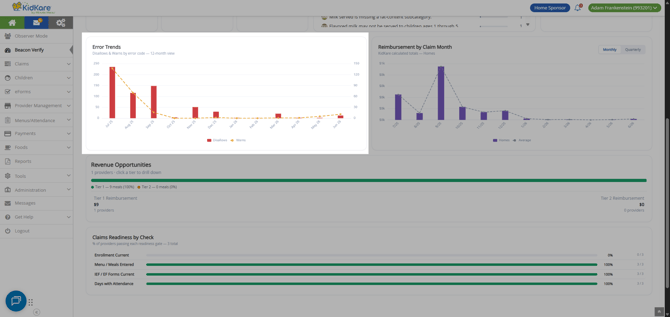
- Error Trends — Disallows and warnings by month over the past year.
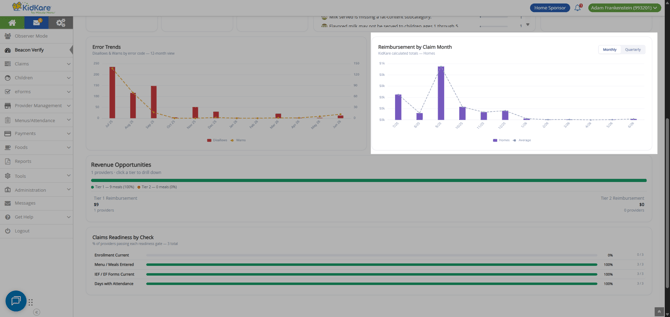
- Reimbursement by Claim Month — Your reimbursement totals, monthly or quarterly.
- Revenue Opportunities — Your provider tiering counts.
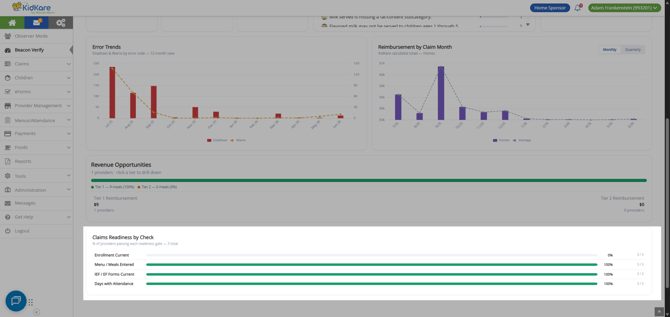
- Claims Readiness by Check — The percentage of cproviders passing each readiness check.
Claims Pipeline
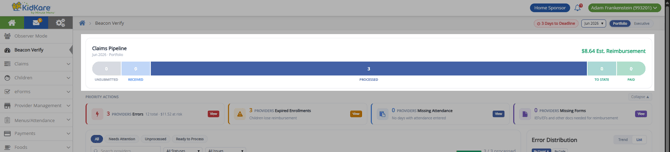
Think of the Claims Pipeline as a visualized Track Received Claims. Think of it as a sales pipeline for your claiming processes. Each segment of this pipeline shows how many providers and claims are in each stage of the CACFP claims lifecycle in KidKare.
|
Stage |
What It Means |
|
Unsubmitted |
The site has not yet submitted a claim for this month |
|
Received |
The claim has been submitted to KidKare and received |
|
Processing |
The claim is currently being processed |
|
Submitted to State |
You have marked the claim as Submitted to State. |
|
Paid |
The claim has been paid or marked as paid. |
Taking Action from the Pipeline
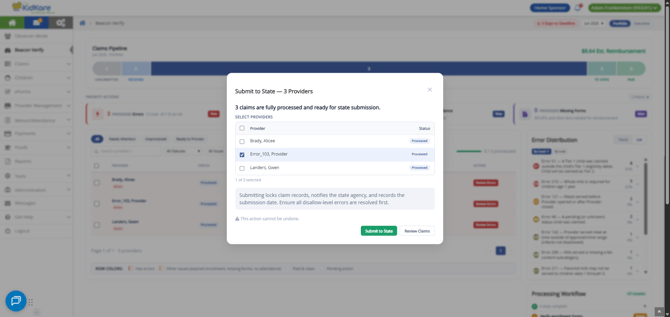
Click a pipeline stage to view the providers in that stage, as well as filter the table detail by that claims stage. All lists open in a pop-up that allows you to either take bulk action or bulk notify your providers and prompt them into action.
For example, say you are ready to submit processed claims to state:
- Click the Processed segment on the claims pipeline.
- Check the box next to each provider's claim to mark as submitted to state.
- Click Submit to State.
What "Blocked" Means
If you see "Blocked" for a claim in these view (or elsewhere), it is merely an indicator that something is missing from the claim. Either there are no meals and attendance recorded, forms are missing, or something else is being flagged. This will not prevent you from either processing the claim or marking it Submitted to state. It is merely meant to be an indicator that a claim needs some additional research.
In some of these situations, the action button (such as Process All) may be disabled. For these claims, use the Review First action to filter the table detail and review those claims. You can then access the Process Claims page to complete processing.
KPI Cards
Executive View comes with six (6) KPI cards that provide high-level metrics for the claim month you are viewing.
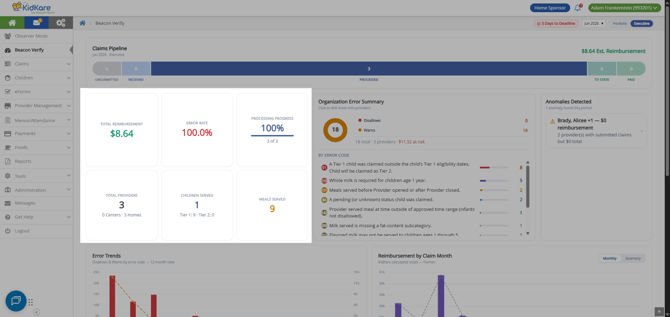
- Total Reimbursement: The total estimated reimbursement for all providers for the selected month.
- Error Rate: The overall error rate for claims in your organization.
- Processing Progress: Total number of provider claims processed against the total expected.
- Total Providers: Total active provider count for the month.
- Children Served: Total count of children served at your provider's homes for the month, broken out by Tier.
- Meals Served: Total meals served by your providers for the month.
Organization Error Summary
The Organization Error Summary shows the distribution of error types across your entire network for the selected claim month. Use this panel to understand which error categories are most prevalent and to prioritize where to focus support or training efforts.
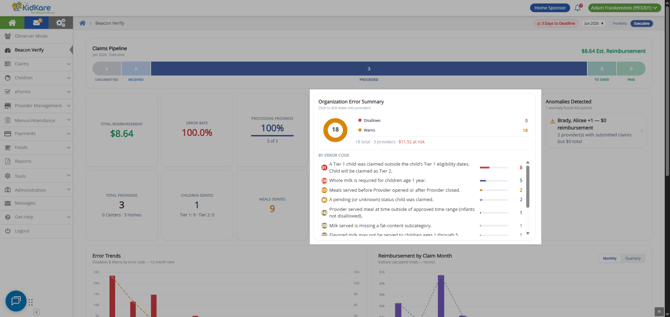
When reviewing the errors in this summary:
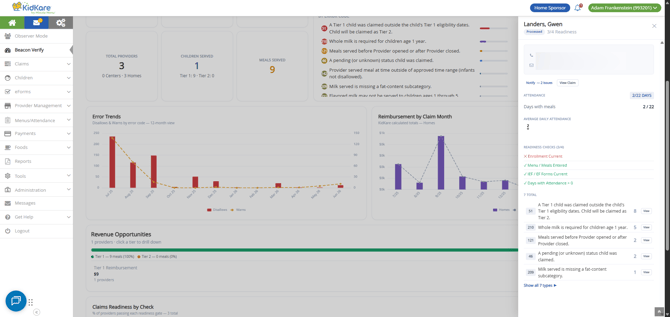
- Click an error to view a list of providers impacted by that error code.
- Click the provider name to view details in the slide out.
Anomalies Detected
This section flags providers that stand out, such as centers with an unusually high error count, zero reimbursement on a processed claim, or zero attendance.
Error Trends Chart
The Error Trends chart shows how the total error count has changed over recent claim months. Upward trends may indicate a training issues, policy changes, and so on, while downward trends may reflect successful training, fixes to policy, and so on.
Reimbursement Trends Chart
The Reimbursement Trends chart shows estimated reimbursement totals over time. Toggle between Monthly and Quarterly views using the buttons above the chart.
- Monthly — Estimated reimbursement for each individual claim month.
- Quarterly — Months grouped into quarters for a higher-level view of reimbursement patterns.
Note: Amounts shown are estimates based on current claim data. Final payment amounts may differ once the state processes the claim.
Revenue Opportunities
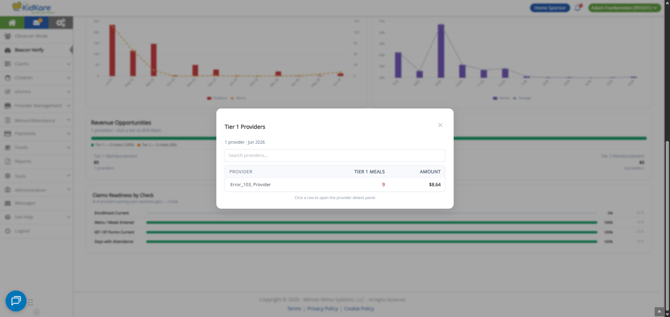
The Revenue Opportunities widget provides a split of all enrolled providers by Tier count.
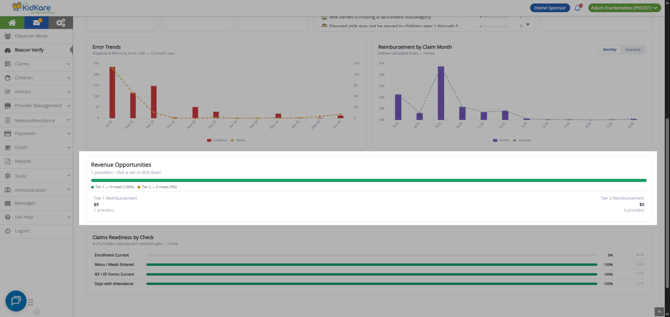
Click a tier to view additional details, as shown below.
Claims Readiness by Check
Readiness Checks
The Readiness score tells you, at a glance, how close a provider is to a clean, submittable claim. For homes, there are four checks:
- Enrollment Current — no children have expired or expiring enrollment.
- Menu / Meals Entered — meals have been entered for the month.
- IEF / EF Forms Current — no required income or enrollment forms are missing or expired.
- Days with Attendance — attendance has been recorded for the month.
A provider is shown as having No Issues when they have no errors and pass their enrollment, menus, forms, and attendance checks.
Note: Readiness checks and the readiness score are presented to inform you that a portion of a provider's claim may need attention. Beacon Verify will not prevent you from processing and submitting claims when issues are detected.