The following Claim Management reports are available. This list is not comprehensive. To access these reports, click the Reports menu, select Claim Management, and then select the appropriate report.
-
Caseload Summary - This report provides a managerial overview to your claiming provider counts. This gives you a picture of the number of homes claimed over a number of months. You can choose the range to examine, and you can break the claiming provider count down by county or Monitor. This report is generated as an XSLX file, so you need a spreadsheet program, such as Excel®, to view it.
-
Claim Change Report - This report prints a list of claim changes or claim adjustments you have made to your claims.
-
Claim Error Analysis Detail by Monitor - This report lists a count of all errors that each provider has on their Office Error reports for a given claim. It is organized by Monitor, so you can find out if one particular Monitor's caseload is behaving differently than another.
-
Claim Error Analysis Summary - This report provides an overview of the breadth of errors being committed by all of your providers on their claims. Each error is listed with a count of the number of times it happened overall, along with the number of providers impacted by the error.
-
Claim List Export File - This is a CSV list of claims and claim details.
-
Child Mailing Labels - This works the same as the Claim List Export File, only it generates provider mailing addresses in the Avery 5160 format.
-
Claim by Source - This report lists all providers who claimed and the source of their claim.
-
Claims Not Received - This report lists all providers for whom a claim hasn't been marked as received in the Track Received Claims function. Note that even if claims aren't actively checked-in via that function, they are noted as received once manually entered or scanned.
-
Enrollment/Days/Meals Edit Check - Federal regulations state that the total number of meal claims should never be greater than the number of children enrolled multiplied by the number of days that meals were served. When claims are processed in Minute Menu HX, a variety of edit checks are performed that prevent users from violating this federal regulation. However, in very rare circumstances, there may be manual claims/adjustments made in conjunction with changes to child data that result in a claim where the total meals are greater than the days claimed multiplied by enrollment. This report detects any such claims.
-
New Claiming Providers - This report lists all providers who have sent in a claim for the first time within the date range analyzed.
-
Provider Claim Totals - This report report lists all provider claims and includes meal counts and other data for that claim.
-
Providers Not Claiming - This report lists all providers who were active in a given month, but who did not claim. If you enter a date range that covers more than one month, it lists providers who did not claim during any of the months within that range.
-
State Claim Summary - This report summarizes information about your entire claim (including multiple provider claims) that you usually need to fill-out state claim reports.
-
State Daily Meal Totals - This report is currently only used in Rhode Island.
-
Track Received Claims Info - This report lists providers for whom you've received claims.
-
Unsubmitted Online Provider Claims -This report lists unsubmitted claims for those providers who claim online with KidKare.
Claim List Export File
The Claim List Export File is useful when you need to find a specific claiming situation, especially in the case of an agency review or audit. For example, the State may request a list of providers who are:
-
High claimers (over $1000)
-
Claiming their own children
-
Claiming dinners or evening snacks
-
Claiming Saturdays and Sundays
While you may need to print this report several times to create several different files that meet the criteria, and then combine them into one file. This is because the Claim List Export File filter cannot perform OR actions—it can only perform AND actions.
To generate the file:
-
Click the Reports menu, select Claim Management, and click Claim List Export File. The Provider Filter window opens.
-
Check the box next to each filter that applies, and then select the criteria. To include all providers, leave all boxes blank.
-
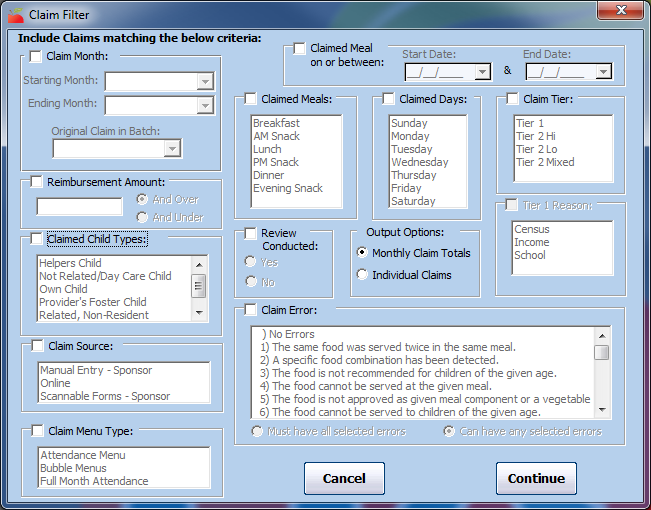
Click Continue. The Claim Filter window opens.
-
Check the box next to each filter to apply, and then select the criteria. Note that if you do not at least filter to a claim months, all claim months are included. To filter to one, specific month, select the same month in the Starting Month and Ending Month boxes.
-
Click Continue. The Select Output Data for Claim List Export window opens.
-
Check the box next to each field to include in the report. You can also click Select All to select all fields.
-
Click Continue. The Save As window opens.
-
Browse to the location in which to save the file.
-
Click Save.
Print the Provider Claim Totals Report
The Provider Claim Totals report lists all provider claims and includes meal counts and other data for that claim. The claim's Tier and the provider's current Tier (per effective dates in their file) are also included on this report.
Claims that are on hold when this report is generated are not included in the report
Each claim record is listed with its appropriate submission batch (Submitted Date). If a claim is marked as Not Yet, the claim has not been marked as submitted. If a claim is an adjustment claim, the value in the Status column is Adjustment. There can be as many adjustment claims for a given provider for a given month, but there should only be one original (core) claim.
The last page of this report contains summary total information, including the Total Homes Claiming and Total Unique Claims fields. These values will be different if a provider has more than one claim record in the given claim month.
The Total Zero-Dollar Homes Claiming field is also listed on the final page. While these providers are included in the Total Homes Claiming count, they should not be counted when reporting to the State, as your agency is not eligible for administrative funds for these providers. Subtract this number from your Total Homes Claiming when reporting a claiming home count to the State.
To print the Provider Claim Totals report:
-
Click the Reports menu, select Claim Management, and click Provider Claim Totals Report. The Select Month dialog box opens.
Notes: You can also print this report from the List Claims window. Click the Claims menu and select List Claims. Then, click Print. You can also click the Claims menu, select Submit Claims to State, and then click Print Provider Claim Totals. If you use this method, go to Step 7.
-
Click the Select Month drop-down menu and select the claim month for which to print the report.
-
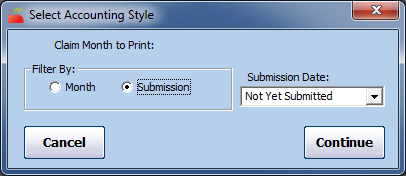
Click Continue. The Select Accounting Style dialog box opens.

-
In the Filter By section, select Month or Submission. If you select Month, go to Step 7.
-
Click the Submission Date box and All Submission Batches or Not Yet Submitted. Not Yet Submitted is the default.
-
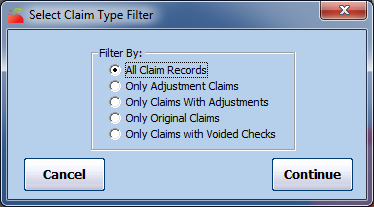
Click Continue. The Select Claim Type Filter dialog box opens.
-
Select the claim type by which to filter. In most states, this would be All Claims Records.
-
Click Continue. The Provider Filter window opens. If you are printing this report from the Submit Claim to State window, go to Step 11 (the Provider Filter window does not display).
-
Set additional filters for the providers to include in this report, if needed. If you don't set any filters here, all providers are included in the report.
-
When finished, click Continue.
-
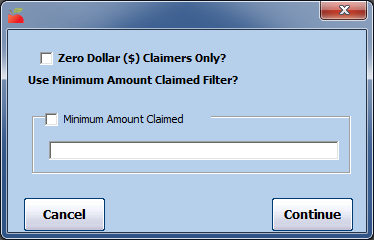
You can now filter by claim dollar amounts, if needed. This can be useful if you're trying to isolate zero-dollar claimers (the entire claim was disallowed when processed). However, you should typically leave these filtering options un-changed when retrieving your state claim report information.
-
Click Continue. The Provider Nested Sort Order dialog box opens.
-
Click the First Sort By and the And Then By drop-down menus and select the primary and secondary sorts for this report.
-
Click Continue. The report is generated.
Print the Providers Not Claiming Report
The Providers Not Claiming report lists all providers who were active in a given month, but who did not claim or who did not record any meals. It includes the following information:
-
Provider Name
-
Provider ID
-
Provider Phone
-
Child Count
-
Monitor
-
CACFP Original Start Date
-
Last Claim
-
Status
-
Removal Date
Use this report to identify providers who are not actively claiming with you. You can use the resulting list as a contact list to call those providers and find out why they aren't claiming, or you can update their status in HX.
To run this report:
-
Click the Reports menu, Claim Management, and select Providers Not Claiming Report. The Provider Filter window opens.
Note: You can also click Claims and select Track Received Claims. Then, click Providers Not Claiming.
-
Check the Status box, and then check the Active box.
-
Set additional filters, as needed.
-
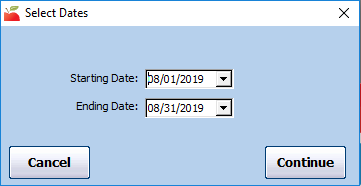
Click Continue. The Select Dates dialog box opens.
-
Click the Starting Date and Ending Date drop-down menus and select dates for which to run the report. If you enter a date range that covers more than one month, it lists providers who did not claim during any of the months within that range.
-
Click Continue. The Meals Recorded Filter dialog box opens.
-
Select No Claim Submitted or No Meals Recorded.
-
Click Continue. The Provider Nested Sort Order dialog box opens.
-
Click the First Sort By drop-down menu and the And Then By drop-down menu and select the primary and secondary sorts for this report.
-
Click Continue. The report is generated.
Print the Claim Summary Report
This report summarizes information about your entire claim (including multiple provider claims) that you usually need to fill-out state claim reports. Note that claims that are on hold are not included in this report, but those providers are included in the Current Active Homes count.
In some states, Minute Menu HX has developed a custom State claim Summary that matches the format required by your state agency. In most other states, this report uses the default Minute Menu HX format. In all states, if you generate this report form the Reports menu (instead of the Submit Claim to State window), Minute Menu HX's standard State Claim Summary format is used.
Typically, you need to manually copy the numbers printed on this report to your State's specific report. However, if you are in a state where Minute Menu HX generates the State's specific report, you do not need to manually copy any part of this report.
Instead, print your state-specific version of this report from the Submit Claim to State window. Filter to All Submissions (if your State requires a re-statement of the monthly totals each time an amended claim is submitted) or filter to specific submission batches (if your State only requires you to report new counts only with amended claims).
To print this report:
-
Click the Reports menu, select State Claim Summary Report. The Select the Month dialog box opens.
-
Click the Select Month drop-down menu and select the month for which to print the report.
-
Click Continue. The Select Accounting Style dialog box opens.
-
In the Filter By section, select Month or Submission.
-
Click the Submission Date box and All Submission Batches or Not Yet Submitted. Not Yet Submitted is the default.
-
Click Continue. The report is generated. If you are in a state that provides supplemental reimbursement funds (in addition to federal CACFP reimbursements), this report prints with twice the number of pages. One set of pages prints the federal dollar totals, and the other prints the state dollar totals. All meal counts are the same, but the dollar amounts are different.
To print the state-specific version of this report, click Claims and select Submit Claims to State. The Submit Claim to State window opens. Click Print State Summary. The report (PDF) is generated.
Fields of Note
The top portion of this report is split into three distinct sections:
-
Claim Tier Breakdown
-
Provider Tier Breakdown
-
Claiming Home Totals
Claim Tier Breakdown
This section provides counts for current active and claiming hoes, as well as zero claiming homes, attendance, and so on.
-
Current Active Homes: This is a count of homes that were active, but not necessarily claiming, for the claim month. These are broken down by estimated claiming Tier. This is estimated because non-claiming providers are included in this count. Use these numbers if your state requires counts of active homes by claim Tier. Otherwise, use the number of active homes in the Provider Tier section. Many states do not require you to report this number at all. Instead, they require the claiming/participating home count. See Homes Claiming, below.
-
Homes Claiming: This is the total number of homes that claimed (participated) in the selected claim month. This is split by claim Tier, not provider Tier. It includes all new homes claiming, but does not include double counts for any homes that claimed and then were adjusted.
-
Zero-$$ Claiming Homes: If a provider has submitted a claim and no meals can be reimbursed, a claim still exists in Minute Menu HX, but it is for zero dollars. These providers are included in the Homes Claiming counts, but they should not be counted when reporting to the State, as your agency is not eligible for administrative funds for these providers. Subtract these numbers from the Homes Claiming counts when reporting claiming home counts to the State.
-
Participated: This is the total number of unique children claimed, split by claim Tier. Mixed Tier claims are further split so you have the totals for Tier 1 and Tier 2 children claimed in such homes. This count is always lower than child enrollment figures, unless you don't maintain accurate enrollment records and have overwritten edit checks performed when saving manual claims. If your State requires a count of enrolled participating that is categorized by Tier 1, Tier 2 Hi, and Tier 2 Lo, you may need to add some numbers on this line.
-
The Tier 1 number corresponds to the Tier 1 count on your State report.
-
Add Tier 2 Hi to the Hi sub-category for Mixed Tier homes.
-
Add Tier 2 Lo to the Lo sub-category for Mixed Tier homes.
-
-
ADA: This is the Average Daily Attendance, which is the sum total of all individual claim ADAs in their respective claim Tier categories. In most states, this is rounded up to the nearest whole number—If all of your ADA totals are a whole number with a single zero after the decimal point, then the ADA is rounded to the nearest whole number on your report. In some states, the ADA includes a value after the decimal point. Mixed Tier homes are further split into Hi and Lo counts to provide an accurate appraisal of Tier 1 and tier 2 children.
Provider Tier Breakdown
This section provides values for your current active homes and enrolled children.
-
Current Active Homes: This is the number of active, but not necessarily claiming, homes broken down by provider Tier (not claiming Tier).
-
Children Enrolled: This is the total number of children who were enrolled, but not necessarily claimed, in that month. This is broken down by Tier. Most states require a count of the number of claimed children, rather than the number of enrolled children. If that's the case, reference the Participated figures in the Claim Tier Breakdown section (above).
Claiming Home Totals
This section provides totals for attendance, new homes claiming, zero-dollar claims, and so on.
-
Total Attendance/Maximum Days Claimed: Use this number if your state requires a modified definition of the ADA, which looks at Total Attendance divided by the maximum number of claimed days for the month.
-
Claim Totals by Submission Batch: This is the submission batch for the given month. This is useful if you only need to report new information to your State for each amended submission, because you must report the correct number of claiming homes that are newly claiming with the amended claim.
-
New Homes Claiming: This is the number of new homes claiming with the listed batch.
-
Zero $ Claims: This is the number of claims in the batch that were for $0.00 total. You should generally factor these numbers out of the report you send to the State. Be careful if any zero-dollar claiming homes appear on your reports. Claiming one of these homes for reimbursement from the State could result in an audit finding, so it is best to identify these homes and either delete those claims completely, or fix the data situation that caused them to be zeroed-out and re-process them.